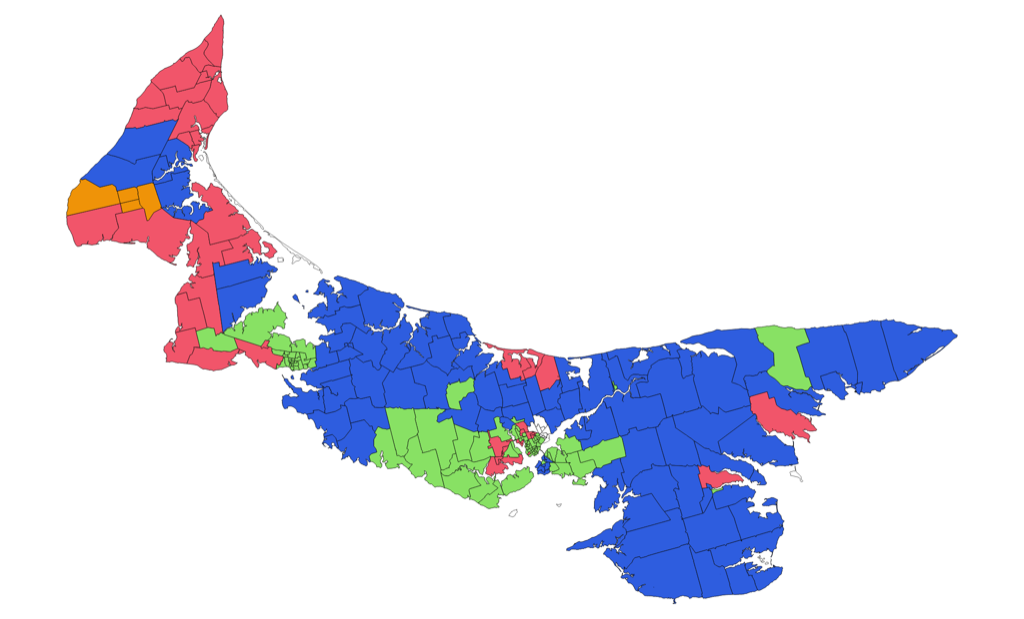
Elections PEI published results of yesterday’s provincial general election as a collection of HTML tables, which are not well-suited when you’re looking for machine-readable data to do interesting things with. Things like this visualization of the winners of each poll:
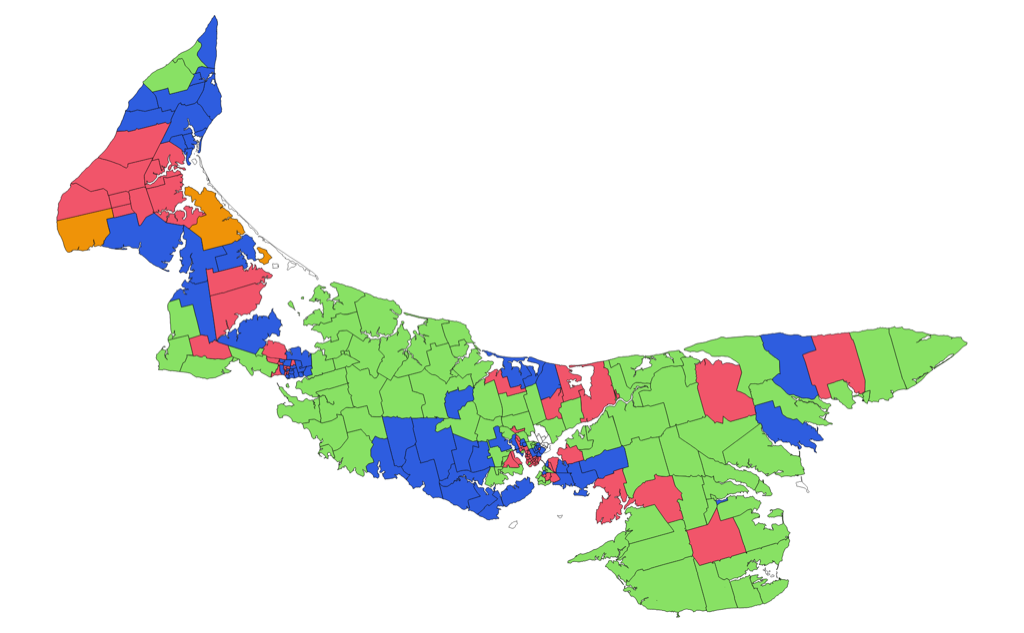
Or this visualization of the party that came second place in every poll:
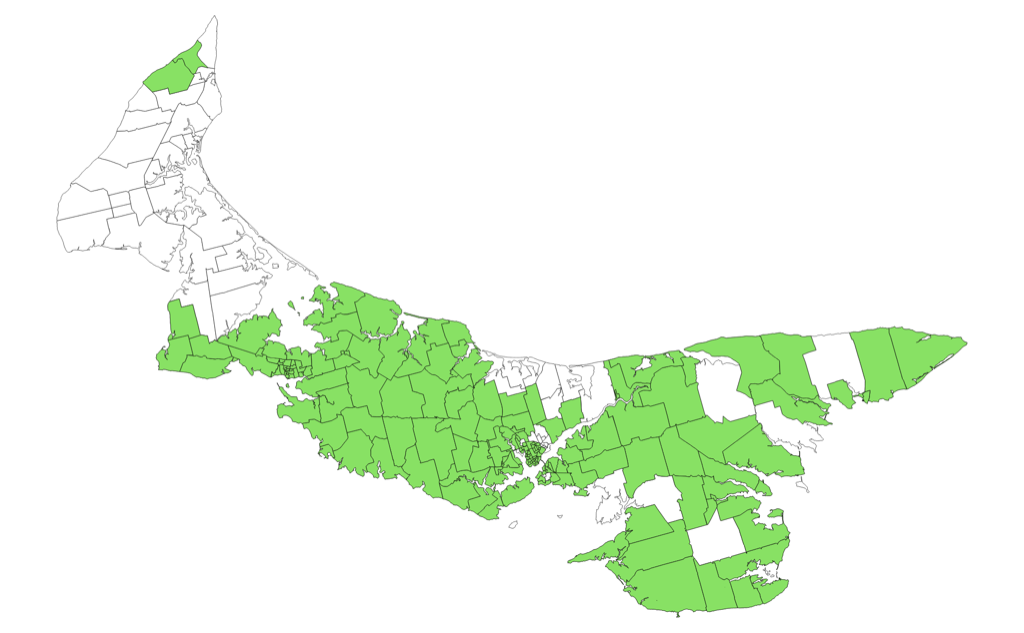
Or this visualization of polls where Green candidates came first or second:
Fortunately, HTML tables are sort of machine-readable to start, and it doesn’t table much to parse them and turn them into something even more machine-readable.
So this morning I wrote some code to do exactly that, and you can download it and take it for a ride or, if you’re just looking for the data itself you can grab one of two files:
- pei-election-results.json is a JSON file of all of the results for each district of each poll.
- pei-election-poll-winners.csv is a CSV file of only the winners of each poll.
It’s that “winners” file that I used to create the visualization above, which you can explore in an interactive version that I’ve just published to the QGIS Cloud.
I combined the CSV file with the Electoral Districts GIS layer. To be able to do this I first needed to create “virtual field” called “distpoll” in the Electoral Districts layer:
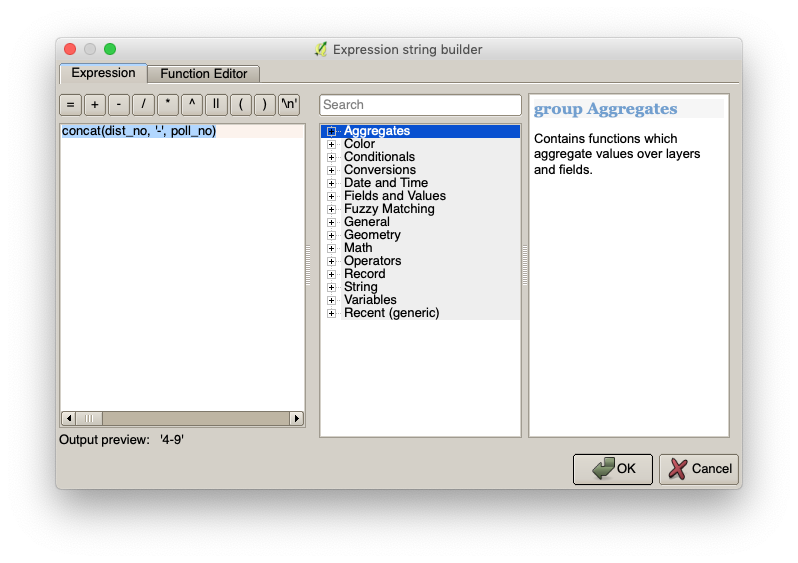
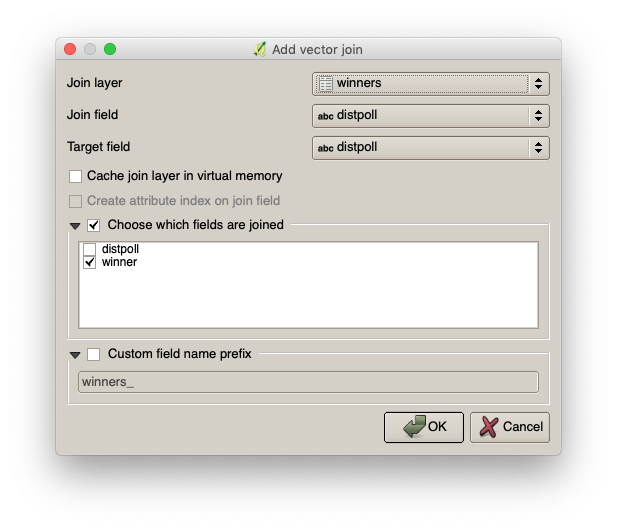
With that virtual field in place, I could join the winners CSV file to the Electoral Districts layer, using the “distpoll” field for the join:
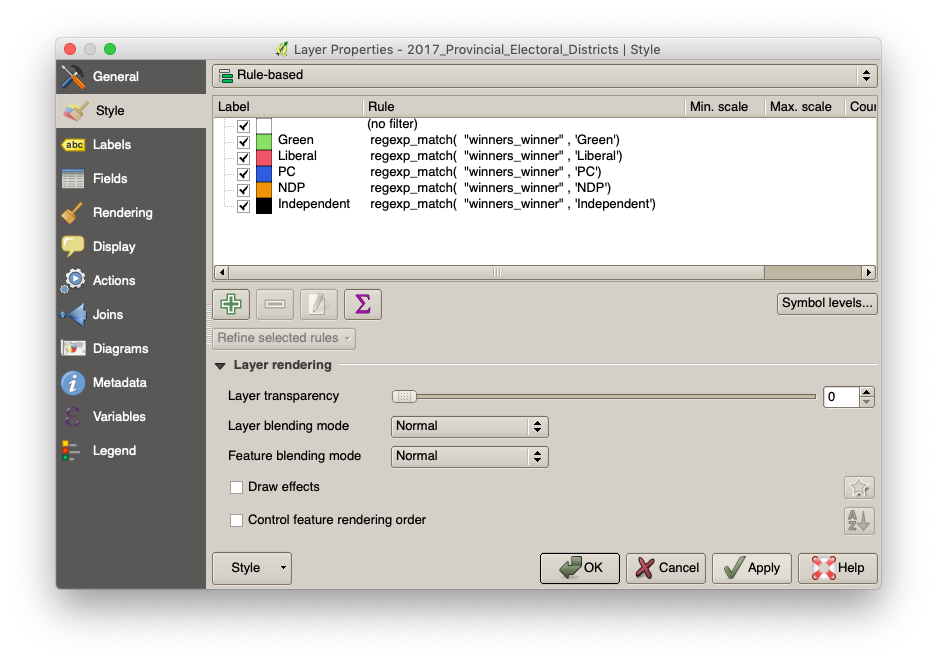
And with the files joined, I used “rule-based” styles in QGIS to colour-code each poll by the winner (leaving those polls with no winner–those in District 9 in this case, where the election was delayed–white):
I’m hopeful that others can build on this code to make additional interesting things from the results.