Crapaud, Prince Edward Island is, as I’ve written aboutat some length, a roundmunicipality.
According to the History of Crapaud, the boundary of the village was set as follows:
It was further decided that the incorporated area should include all land and water within a half mile radius of Crapaud Bridge, which spans the Westmoreland River, on the present course of Highway Route No. 9.
To ensure that OpenStreetMap’s representation of Crapaud aligns with this description, I moved the point marking Crapaud to 46.2398387, -63.4997392, the centroid of the circle that describes the boundary:
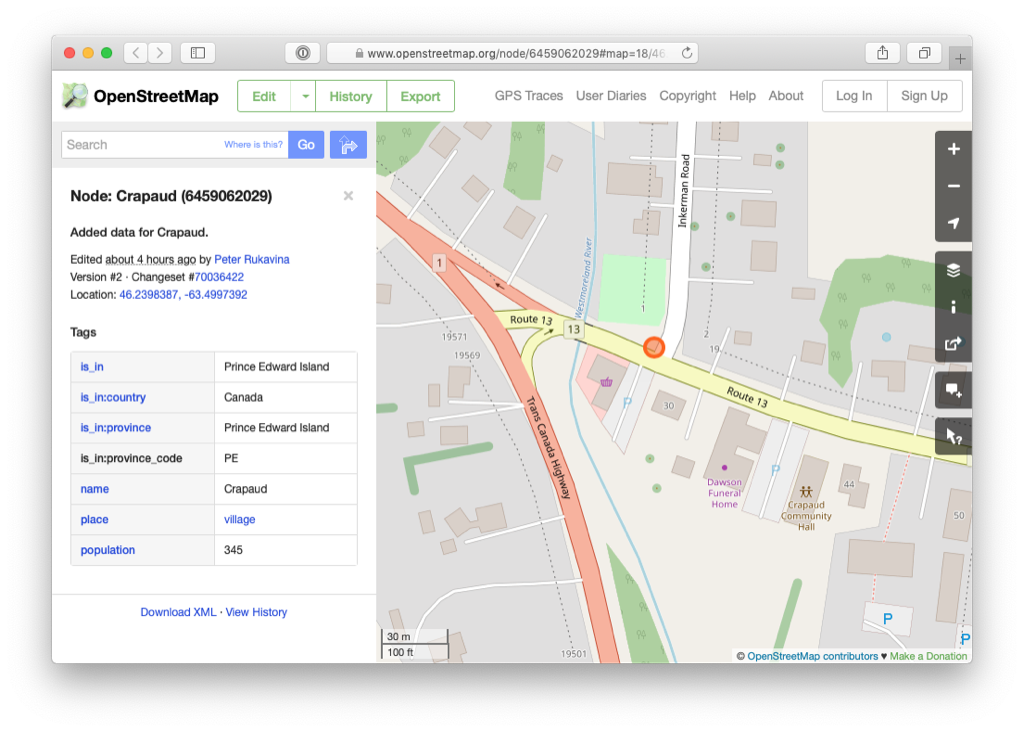
Eagle-eyed readers will note that this point falls about 30 meters east of “Crapaud Bridge, which spans the Westmoreland River,” which is where history describes it. It turns out that proclamation in the Royal Gazette of Crapaud’s incorporation refers only to “Crapaud Corner,” without a more specific geographic location; when digital cartographers of yore created the Crapaud municipal boundary in its contemporary digital form they thus had to take their best guess, and what you see in OpenStreetMap is the boundary they came up with.
With the centre of Crapaud now fixed (at least close to) its proper location, and with the work I’ve been doing all winter long to fill out the roads, buildings, driveways, sheds, trees, rivers and forests of Crapaud in OpenStreetMap, I can now use the lovely and powerful Overpass Turbo tool to do some interesting things.
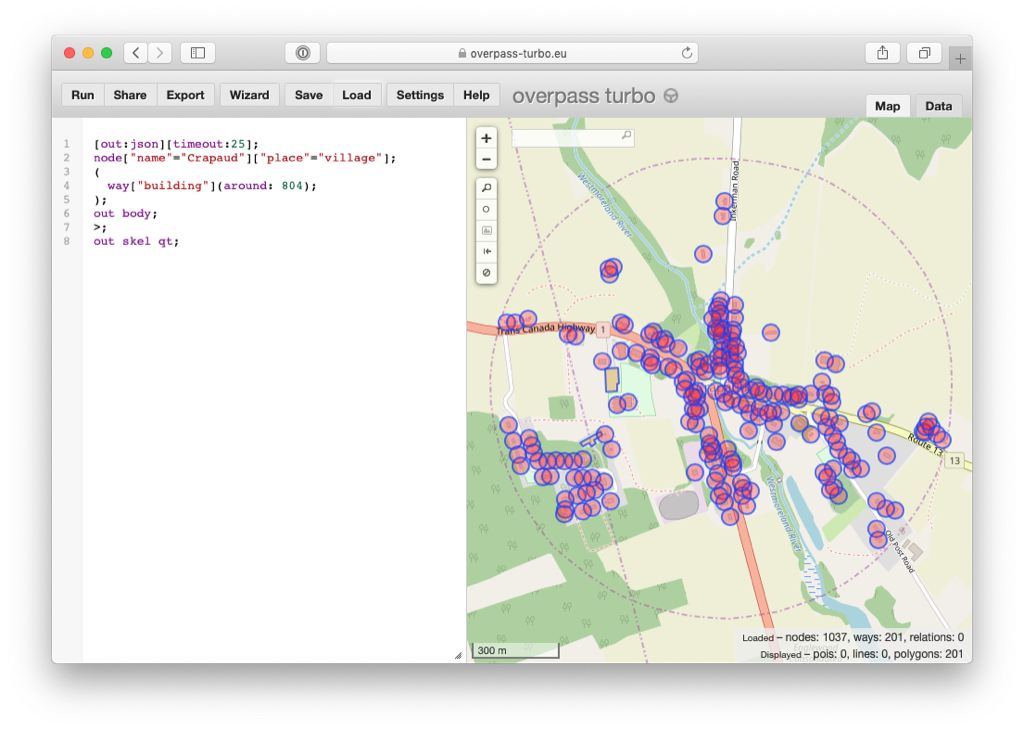
For example, here’s a query to extract all of the buildings in the village:
[out:json][timeout:25];
node["name"="Crapaud"]["place"="village"];
(
  way["building"](around: 804);
);
out body;
>;
out skel qt;
The key part here is the (around: 804), which says “include everything within 804 metres of this node.”
It so happens that 804 metres is 0.5 miles. So this says, in other words, “in Crapaud.”
On a map this looks like this:
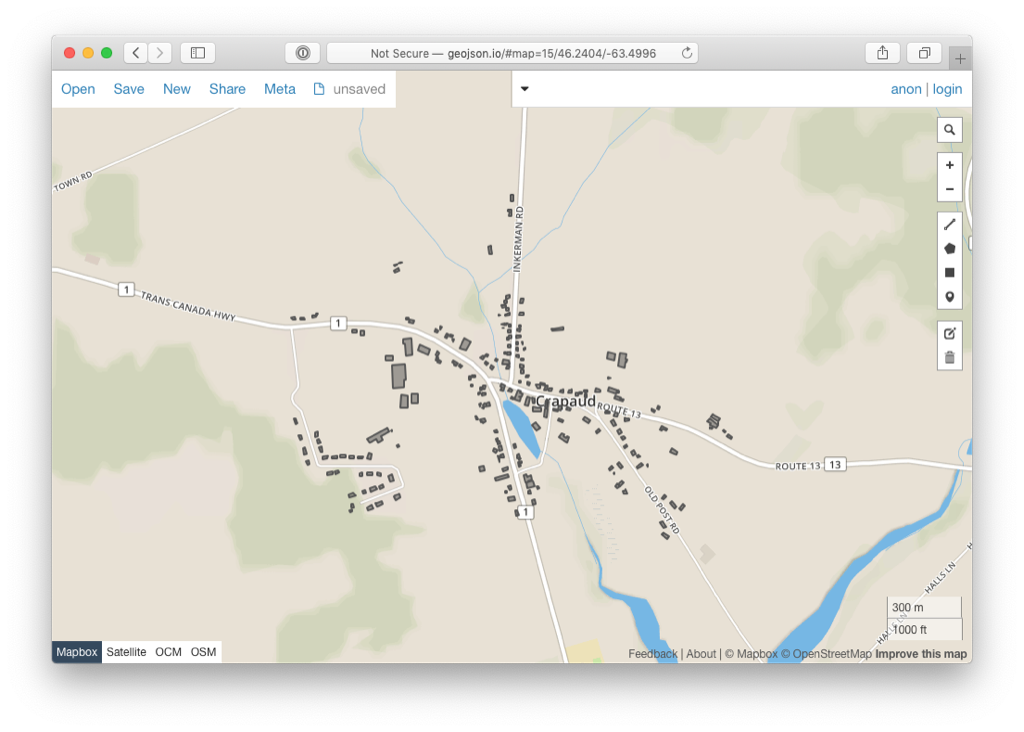
Exporting the results as GeoJSON results in a file that can then be imported into geojson.io:
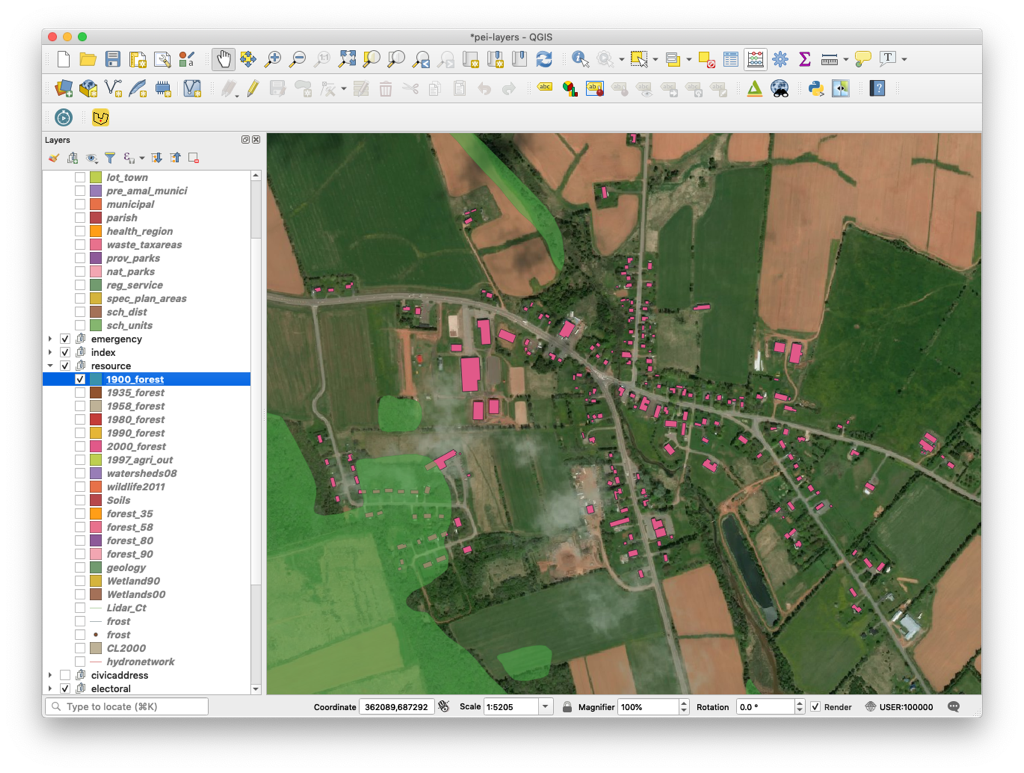
Or I can import the GeoJSON file into QGIS, and visualize it with public GIS data, like the 1900 forest layer, something that shows that the subdivision of Sherwood Forest (in the lower-left) used to actually be a forest:
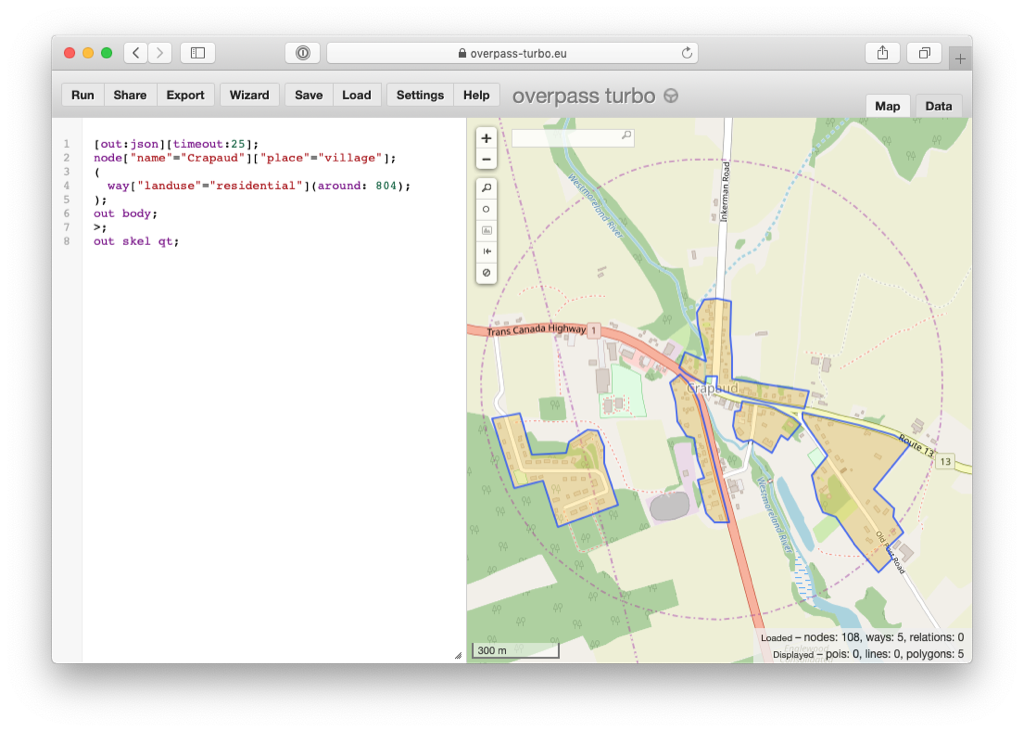
But it’s not only buildings: this query shows polygons where residential land use has been tagged:
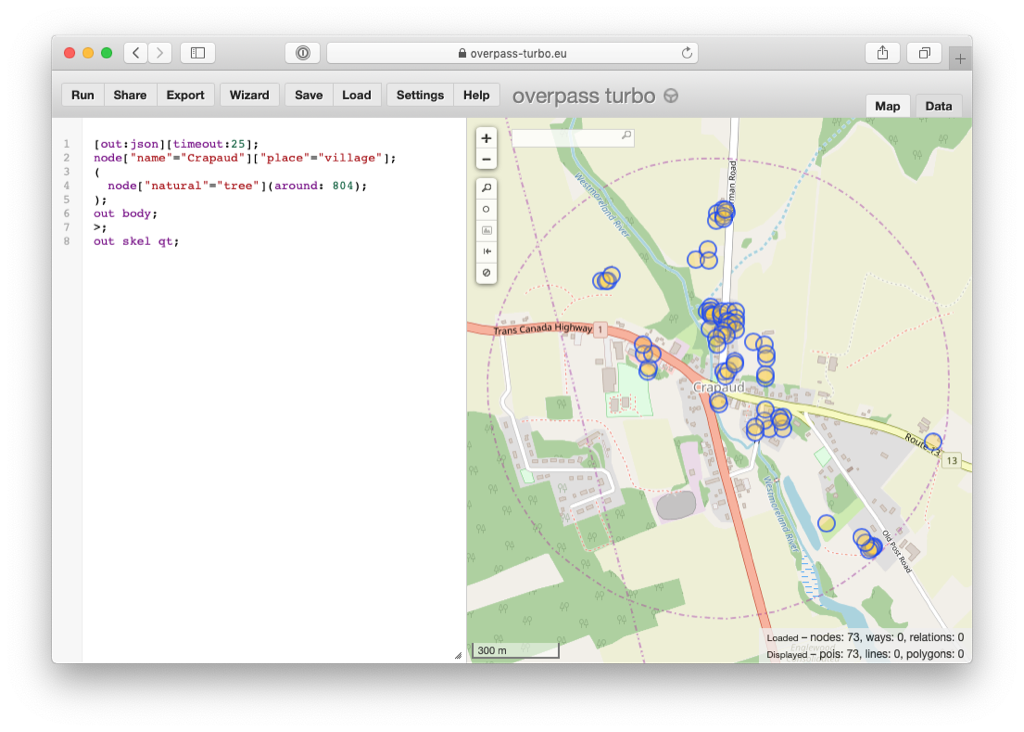
And this query extracts all the points marked as individual trees (as opposed to areas marked as “wood”):
I’ve so long thought of OpenStreetMap as a map, and of course it is that.
But it’s also a database with a powerful set of open tools that use open formats, meaning that the effort to keep the map up to date has all manner of unintended other benefits.